Wind Analysis is very common, but the dynamic effects are often over estimated or even worse overlooked. In this case study, we walk through the approach taken to simulate the stress due to aerodynamic loading through a billboard. This case study walks through the Method, the Physics, and the Results of a case study that was originally presented at Autodesk University 2019.
RESEARCHING BILLBOARD DESIGN
Billboards come in a wide variety of layouts and structural configurations. The goal here is to provide a billboard with which to highlight the associativity between Autodesk CFD and Autodesk Nastran In-CAD, as well as to leverage a structural configuration that may not be ideal. Thus would provide us great foundation for learning how to best apply these tools.
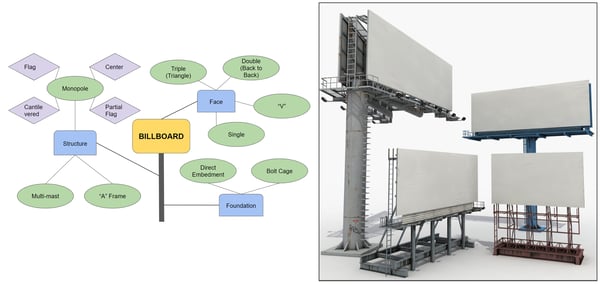
After some discussion, the design chosen for this investigation was the "Back-to-back" Cantilevered Monopole with bolt cage. This allows us to analyze "head-on" wind loading, which is predicted to be worst case. The overall design is relatively simple and so it can be compared to hand calcs of a vertical flat plate. The overall approach here is to start simple, gain confidence, and then add complexity as you build competence. This is works for students as well as designers.
CREATING THE RIGHT "LEVEL OF DETAIL" FOR CFD
One of the "classic" problems we have in Computer Aided Engineering (whether for structural or fluids simulation), is the need to defeature the CAD file. In this case, where the Inventor model has the fully detailed weldment (needed for structure analysis) that detail is not needed in CFD. It's not the geometry detail that is our focus (we want to keep that!) but rather the computational "weight" of the model.
In other words, trying to bring 150+ parts from CAD to CFD, is going to be a waste of time and most likely a huge headache no matter what software you are using. Instead, our strategy here is to strip the model (not the detail) down to one part, so we can then use it to create a cavity in our air volume. Remember, in CFD the focus is on analyzing the air around our structure, not the structural assembly itself.
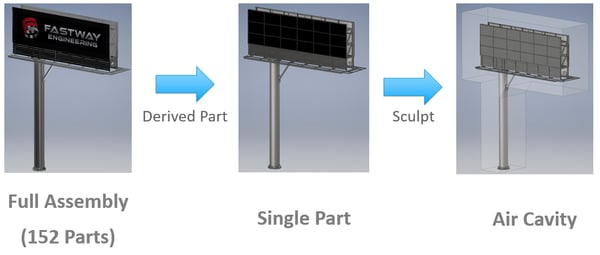
This is quite easily done in Inventor using a Derived Part and the sculpt feature. Although there are other ways to do this, this method allows us to easily create and modify on-the-fly additional, parametric air volumes around our structure to manage our mesh density as needed. As can be seen below, creating this geometry parametrically is really easy in Inventor, and it will allow us to fine tune our mesh later - a step that is often overlooked and can result in a lot of overall time savings.
SETTING UP THE CFD MODEL
With the CAD model ready, the next step is to set up the CFD model. To do that, accurate velocity boundary conditions are needed. In architectural aerodynamics, the wind is constantly changing - both in magnitude and direction. To distill this case study down to a manageable investigation, the wind velocity was chosen at just two states, Average and Gust, where each would be analyzed in Steady State (for now!).
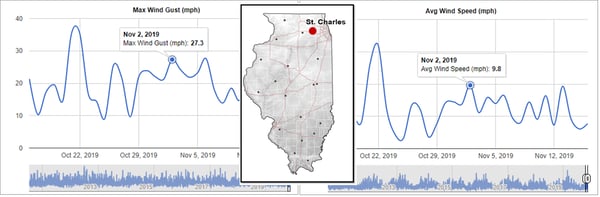
Simple internet research pointed us to the Water and Atmospheric Resources Monitoring (WARM) Program, which offers a lot of detailed data, including a really neat wind map animation of the United States.
To be timely and relevant, we decided to use the November 2019 Chicago Area Wind Speeds (the month we originally presented this topic at Autodesk University). , and on the right you can see the detailed data we extracted our wind velocities from.
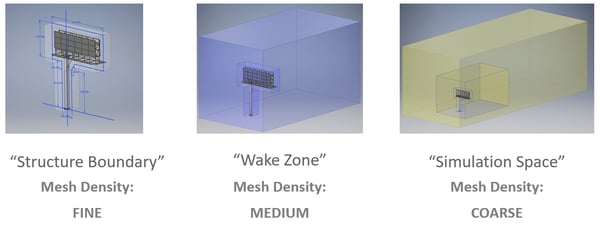
With everything needed to start simulating, we jumped right into Autodesk CFD, and built out our model using the the proper velocity, pressure, and slip boundary conditions. At Fastway, we are always striving for a mesh independent solution, and every analyst should do this. Therefore, early simulations start relatively coarse ,and tighten up as we review the results and how they look. For example, we know for our average wind speed steady state analysis, that our free stream velocity is 10 mph. If the walls of your analysis are too close to your flow impedance, then it will start to "squeeze" the flow, and create additional error into the analysis (yes, this is true even if you use the slip/symmetry condition). If the analysis volume is too large, then you just end up waiting too long for results.
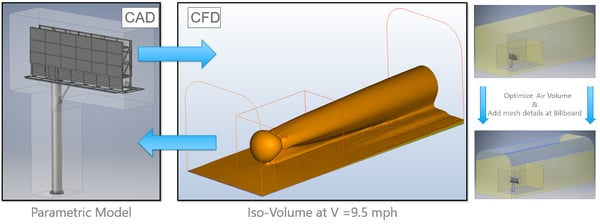
To optimize our air volume, we used an iso-volume set to 9.5mph and watched it's shape as we changed the size of the "virtual wind tunnel" that we had created. After just a handful of iterations were able to cut down the size of the volume quite a bit, and then use the extra computing power to add finer mesh details at the billboard. This ensured that we could get the proper boundary layer mesh height associated to our turbulence model. This increases the numerical accuracy of our force predictions. Recall that for K-epsilon, you should have a y+ value between 30 and 300, and for K-omega, y+ should be equal to 1.
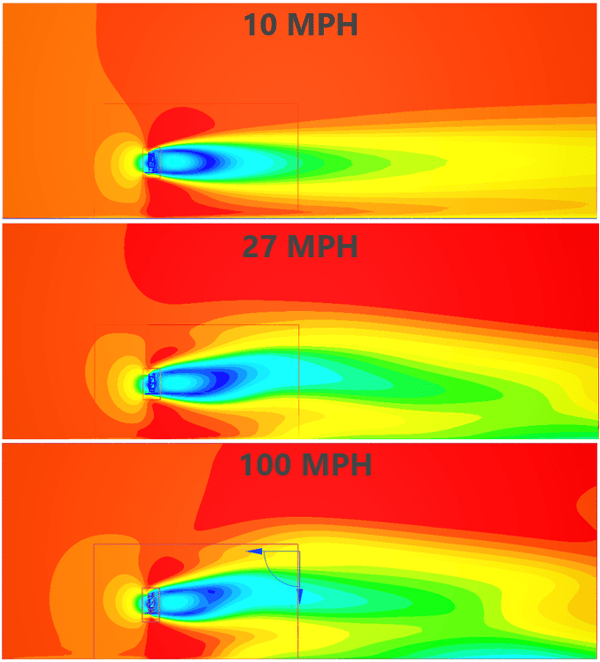
THE CFD RESULTS
Before we start looking at CFD results (and especially before we start extracting force values), it is critical to do some simple hand calcs. If you recall, we strategically chose a "simple" billboard design (the cantilevered Monopole), which is basically just a vertical plate. Assuming the airflow is perfectly normal to the billboard, the force acting on it is equivalent to the change in momentum of the air. Assuming the air hits the billboard and comes to a complete stop (velocity = zero), that results in the equation below.
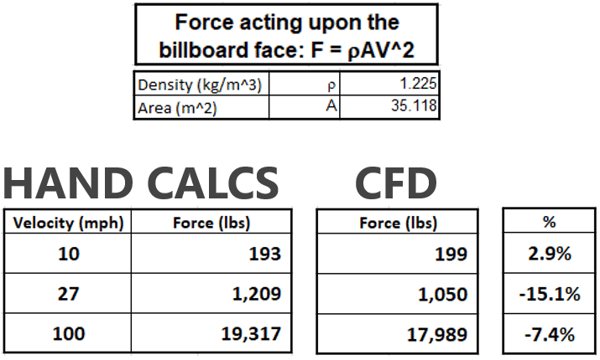
When we enter the wind velocities and compare to the theoretical values, we get correlation within 15%, which is not bad considering the actual CAD is more complex than a theoretical vertical plate, and we are using a steady-state, Reynolds Averaged Navier Stokes approach - there are always several sources of potential error (hopefully they cancel each other out!).
PREPARING THE CAD FOR FEA
With the results of the CFD analysis in our hands, now we can turn our attention to the structural aspects of our investigation. First, we need to prepare our CAD model for import into Nastran In-CAD. Since our area of interest has shifted to the mechanical structure, and not the airflow around it, we must ensure the we have the proper level of detail.
MODELING 2D BEAMS VS 3D SOLIDS
Full disclosure: in order to properly map the CFD results to FEA, we need to have the same 3D volumes in both models. Simplifying weldments to 2D Beam elements is an accepted practice, but in our case won't work for mapping the direct CFD pressures. We include it here for an academic exercise, however if you are more interested in directly mapping the CFD results, skip to the next section.
DIRECTLY MAPPING CFD RESULTS TO FEA
A SIMPLIFIED METHOD FOR ANALYZING OUR BILLBOARD
STRUCTURAL FEA RESULTS - STATIC
WEIGHT ANALYSIS OF THE BILLBOARD
MODAL ANALYSIS OF THE BILLBOARD
DISCUSSION AND NEXT STEPS...