Not only did the "Space Race" of the 1960's launch the human race out of the grips of Earth's gravity, but it also launched Designers and Engineers out of the grips of hand calcs and slide rules and into the new, unknown world of Computational Physics. Fast forward a few generations, and now we are dependent on Computer-Aided Engineering (CAE) tools like Finite Element Analysis (FEA) an Computational Fluid Dynamics (CFD) to help us design, analyze, and optimize our designs.
Optimization began as a manual "Designer in the Loop" process, which involved someone assessing the results of a series of analyses against their design criteria - for example, Factor of Safety. However, with the advancement of hardware and software, a growing category of Structural Optimization tools are automating this computationally expensive and time consuming process.
This article walks through the process of capturing the load cases from a SpaceX Falcon Rocket, and using them to optimize an Optical Bracket on a CubeSat (similar to those shown above, courtesy of Cagri Kilic) using some of the latest tools in PTC Creo, such as Topology Optimization.
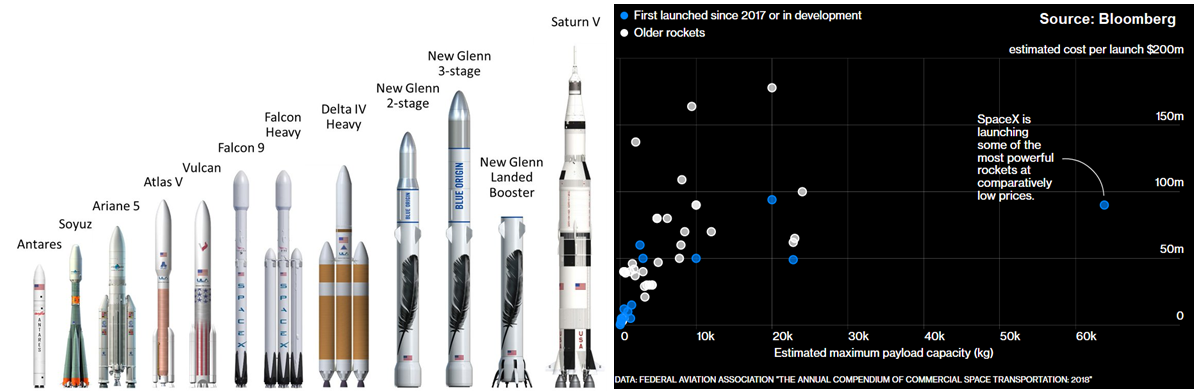
Commercial Space Travel Costs
Before we jump into the case study, let's recap why this is so relevant. Until now, the price of launching a satellite has been prohibitively expensive, with "typical" prices being near $22,000/kg ($10,000/lb). This launch cost is a function of, among other things, the mass which you are lunching (moving mass burns fuel, duh!). More recently prices have been dropping for two main reasons: Competition & Technology.
The Commercial Space Industry has seen rapid investment and growth, most famously from SpaceX, who's "Falcon Heavy" Rocket Claims to be able to get stuff in space for $1300 $/kg, which is over 1/10th the traditional cost!
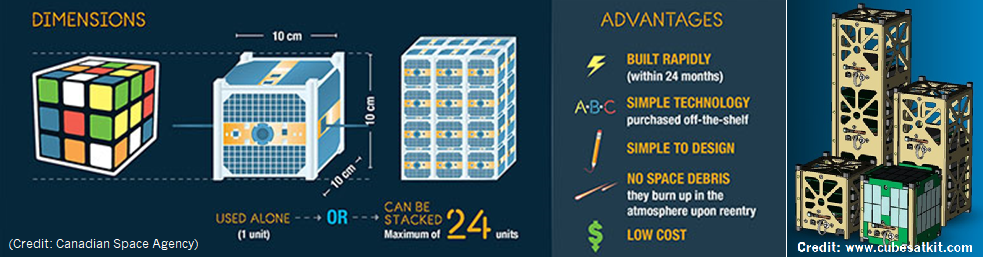
On the Technology side, a more recent solution to reduce the cost of getting into a Low Earth Orbit is the CubeSat, which is a type of nano satellite with a standardized shape, and mass as shown below. The specification was originally developed in 1999 by California Polytechnic State University, San Luis Obispo and Stanford University's Space Systems Development Lab.
The spec (which can be found at http://www.cubesat.org/) includes all of the Outer Dimensional Drawings (ODD's) and Interfaces Documents needed to develop your own CubeSat. The best part of the design is that it is scalable. Thew smallest unit, called a 1U, 10cm^3 with a max mass of 1 kg. The Cubesat dimensions can scaled up, fore example a 3U would be 10cm X 10cm X 30cm, and then has a maximum mass of 3kg.
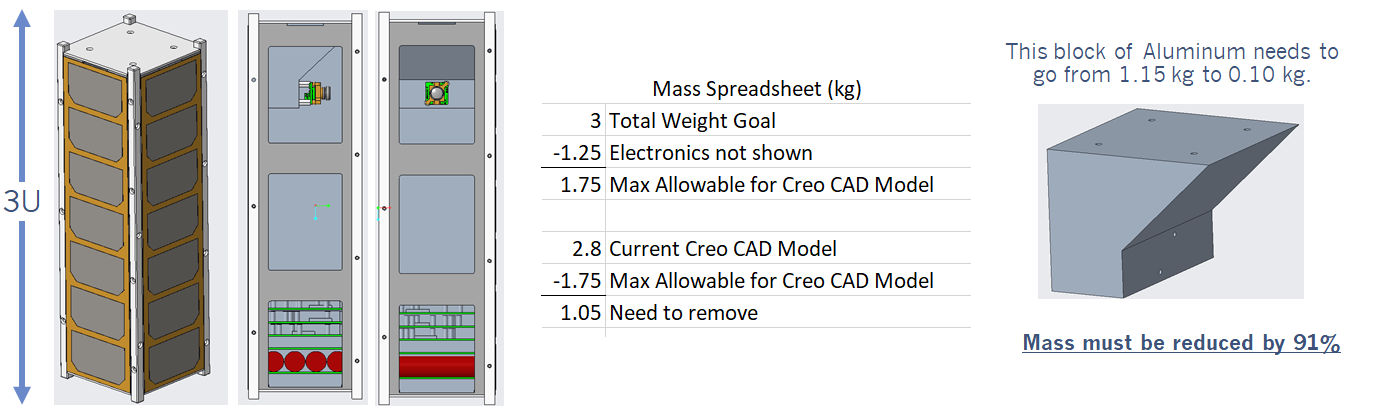
For the Fastway CubeSat, we chose a 3U layout, as we'll be putting about 3kg of stuff in it, plus it allows us to put larger solar cells on the outside without a complex folding design. We start by throwing a stack of Printed Circuit Boards (PCB's) at the bottom, including the On Board Computer (OBC), the Electrical Power System (EPS), Antennas, Sensors and Energy Storage. On top of that we have some empty space - in real life, it will house some additional wires and electronics, but we have omitted them from the model here.
Then, on the upper cavity we have a camera to take some awesome pictures of our Galaxy. Now, this camera includes a fairly fragile optical assembly that needs to stay precisely aligned, so we need to make sure that it is securely fastened to the CubeSat structure during the Launch sequence.
Using Creo Parametric, We start with the most rigid thing we can think of - a big block of Aluminum 6061. This block represents our design space for our structural optimization design challenge. To get our weight reduction design, we use a weight spreadsheet as shown below, and come up with a goal of reducing the weight of that bracket by 91%.
SpaceX Falcon 9 Launch Loads
Next, we need to characterize the accelerations that the Fastway CubeSat will experience during launch, so we can determine if it will survive. Thankfully, to the aforementioned democratization of space travel, companies like SpaceX make loads of launch data available to the public. Using the User's Guide for the Falcon 9 (downloaded from the SpaceX Falcon 9 website). From here, we get loads in two categories: Static and Dynamic.
Falcon 9 Static: Constant Acceleration
The Falcon 9 User's Guide contains a "G-G Map", for constant acceleration in the axial ("vertical" as launched) and lateral (all vectors normal to axial) directions. We see here that the maximum is 8.5 G's in the Axial direction, and since we're not exactly sure which orientation our CubeSat would be installed in, we'll use that as a worst case static load in all directions.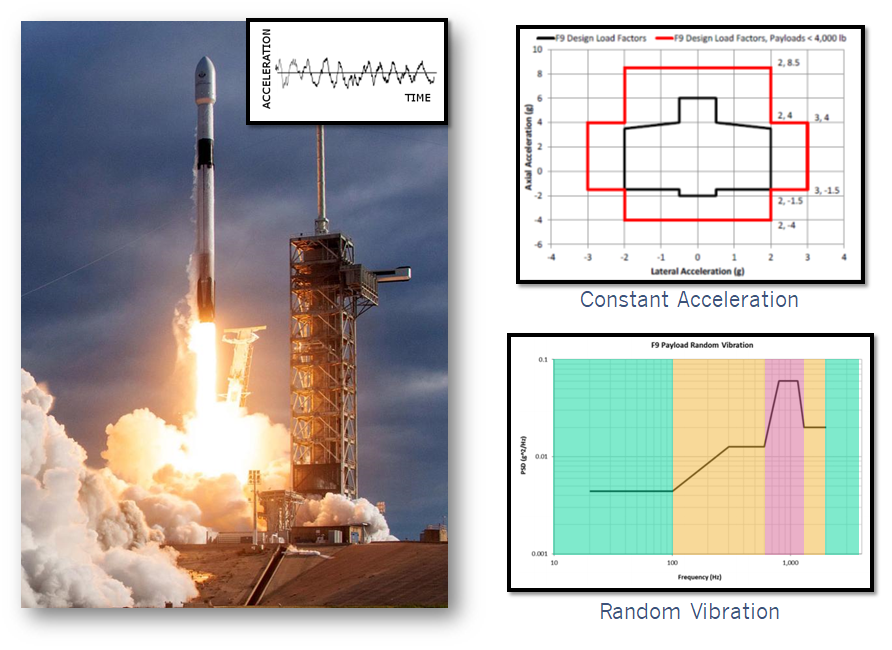
Falcon 9 Dynamic: Random Vibration
The Falcon 9 User's Guide also contains a "PSD Plot", which describes the amount of energy that our CubeSat would need to withstand across a range of frequencies. In reality, if an accelerometer were put on the Fastway CubeSat during launch, we would see "random vibration ("white noise"). In reality, it would experience a range of accelerations and a range of frequencies all at the same time. Looking at the plot, there are some small accelerations in the <100Hz range, but some larger ones closer to 1,000Hz range. This could be an indication of a system level resonance, perhaps from the overall rocket structure, or rockets engines themselves. To make it easier to read in a quick glance, we shaded increasing harsher environments with orange and red.
A full Random Vibration FE Analysis to predict stress is outside the scope of this study, so instead we will use a Modal Analysis. A Modal analysis predicts the resonant frequencies of a structure, so we'll just use that to make sure the First Mode Frequency of our Optical bracket stays above 1500 Hz (the right-hand side green shaded area of the PSD Plot above)
Structural Optimization in PTC Creo
To tackle this problem, three different Structural Optimization approaches are going to be taken using several different Finite Element Analysis Techniques in PTC Creo.
Creo Simulate Live (Powered by Ansys)
Typical approaches of manual trial-and-error can be quite time consuming going back and forth between parametric CAD and Full Capability FEA. For example, to use traditional FEA such as Creo Simulate, this simple bracket would be meshed, solved (to convergence with high order elements), and then post processed at each design iteration. We timed FEA Iteration, using just the Quick Check 3rd Order elements to be approximately 10 minutes. This means that the 8 iterations below would take about 1.5 hours of just solving.
To speed things up a bit, Creo has a new FEA option called Creo Simulate Live (CSL). CSL allows an FE Analysis to be created and run "Live" (on the fly) as you continue to update and modify the CAD model. It does this because it does not use a traditional mesh-solve-post process technology, instead it leverages the GPU (Video Card) to solve and Post-Process simultaneously. It does this through a unique partnership with Ansys, who developed the technology alongside Nvidia.
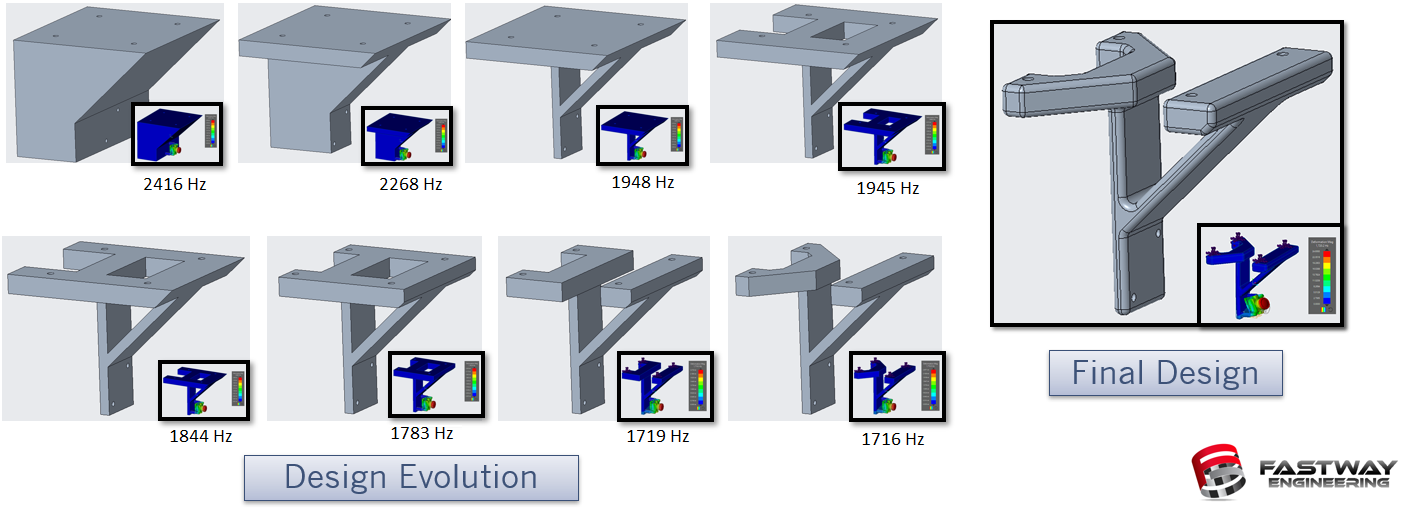
The setup time for a CSL analysis is about the same as in Creo Simulate (Material Properties, Boundary Conditions, and Loads all still need to be applied). However, it takes just a few seconds to start getting results. As it constantly displays the results, the design can be updated as usual, and the results automatically updates. CSL predicted the final design above to resonate at 1720 Hz. (Scroll to the bottom of the page if you want to see what traditional FEA predicts).
Topology Optimization
Topology Optimization (Top Opt)is an algorithm-based structural optimization capability, that has recently become available in PTC Creo. It performs the same function as the "traditional method" that was outlined above, however there are two major differences:
- The shape is not bound by parametric features, but rather a solid mesh similar to traditional FEA
- Material is removed automatically, with no intervention from the designer
This results in a very organic, highly optimized shape. The downside is that to fabricate these using traditional methods (CNC Machining, Casting, Forging, Sheet Metal) they must be post-processed and optimized for the fabrication method (DFM'd) by the designer. Within Creo, there are a lot of Fabrication constraints that can be added to the algorithm, but without going into the full detail of the Top Opt capability in Creo, it's safe to say that no algorithm can replace the DFM knowledge of an experienced designer.
Below, are several screenshots showing the progress of the Top Opt algorithm as it s removed material. The input for the algorithm was as follows:
- The starting volume of the bracket (the "design space")
- Keep Out volumes shown in red below, where material is not removed
- Modal Analysis and Constant Acceleration Load Cases
- Weight Mass Fraction Goal of .09%
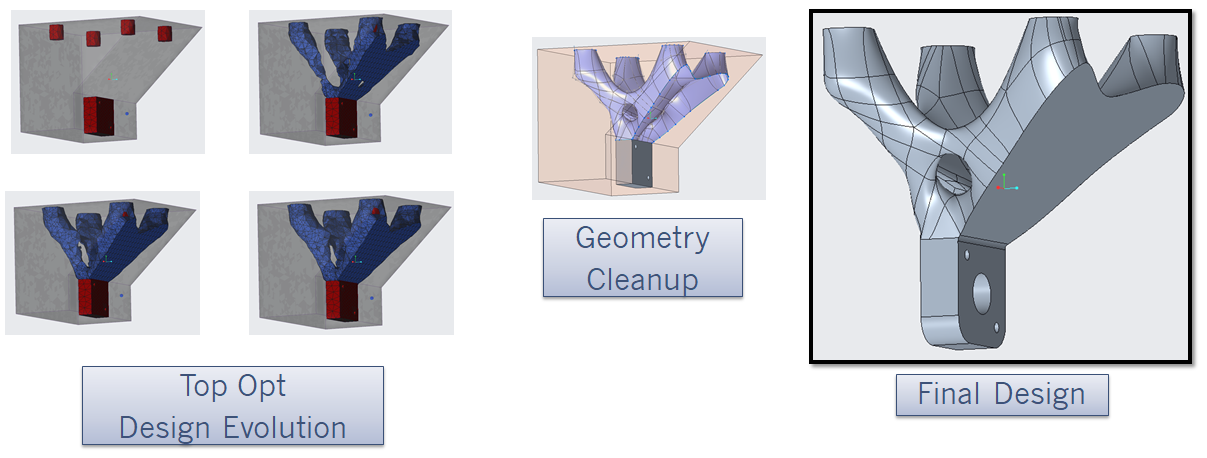
Once the algorithm is done, the shape is displayed as a triangulated mesh. This is not a surface quality that can be used for subsequent design or manufacturing, so Creo has an option to "Export as Freestyle Feature" which allows Creo to create a watertight surface model and then solidify it into a usable volume. The Freestyle feature is highlighted above as "Geometry Cleanup", because that model must be manually adjusted afterwards. There are sharp edges at the boundaries, instantaneous changes in curvature, and other awkward surfaces that need to be cleaned up before moving forward into the solid model. This can take quite a bit of time, on top of the Top Opt algorithm which can take several hours depending on the complexity of the problem and the computing power available.
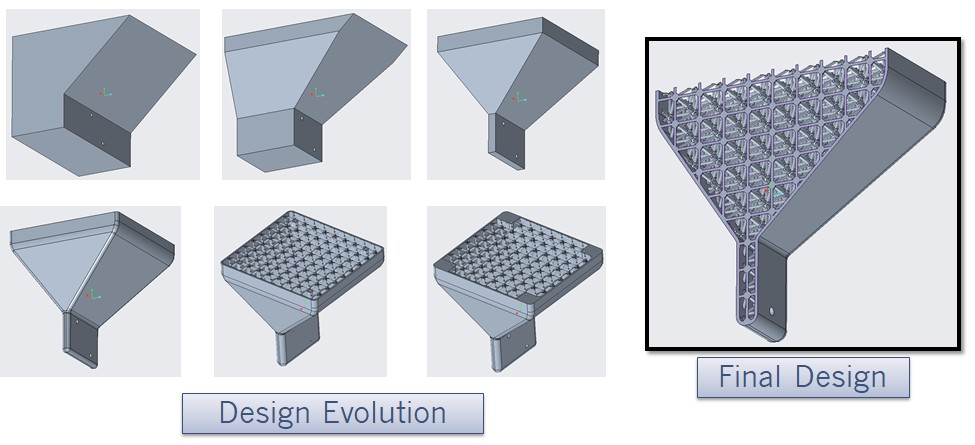
Lattice Structure
Finally, we utilize a design approach that allows us to remove material internally (in contrast, Top Opt removes material externally). This is done by leveraging the capability within PTC Creo to create a parametric Lattice structure within a hollow shell. This will allow us to reduce weight using extremely thin wall thicknesses, while still avoiding potentially new failure modes, like buckling.
For this design approach traditional trial-and-error was used, checking the first mode frequency with a Modal Analysis in Traditional FEA. One of the really neat features in Creo is that lattice structures can be represented as full solids or simplified beams. Full solids take a long time to regenerate ,and should only be used for the final model to be sent to manufacturing. Until then, simple beams are all that's needed. The best part here, is that those beams are automatically converted to beam elements in Creo Simulate. This means we can obtain a mesh independent solution with a much lower mesh count, than having to mesh through the thickness of every single beam.
For the design approach, material was removed away from the outside first. Then the part was hollowed, and lattice structure added. Trial-and-error was used to get the weight down and keep the beam thickness and lengths away from buckling failure. Finally, mass was added back at the mounting holes to remove stress concentrations that were showing up in the modal analyses. This design evolution, and the final shape is shown below.
Validating the Design with Traditional FEA
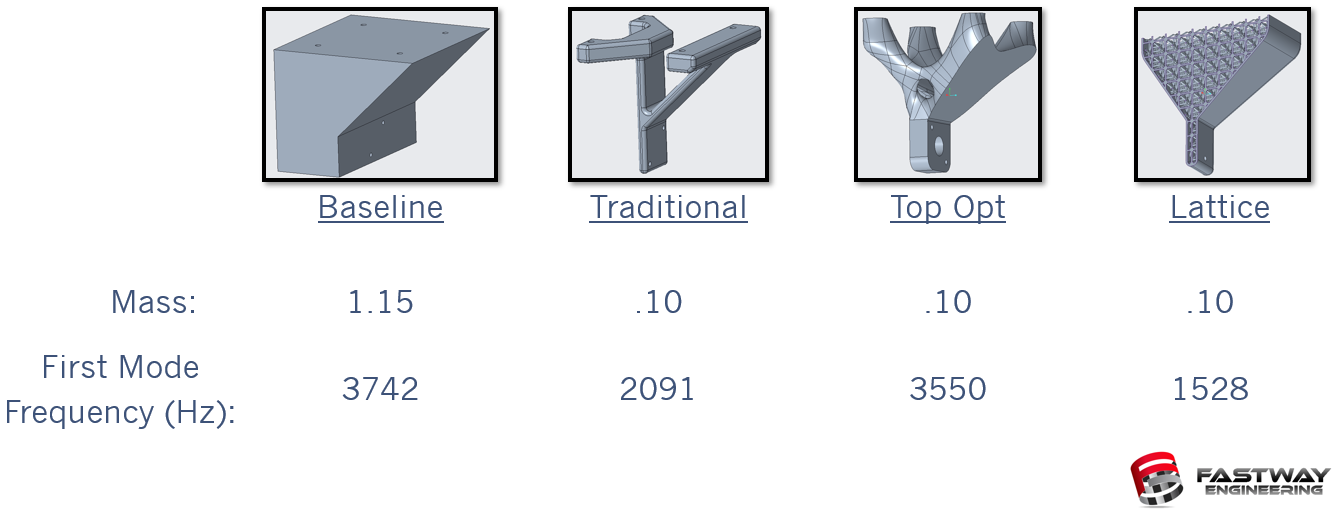
Just because we have all of these new tools doesn't mean we immediately forget the tried and true ones that we have been using, correlating to test data, and thus trusting, for decades. So, the investigation is not complete without rerunning the modal analyses for all of the designs with a full blown FEA solver, and a mesh-independent solution. For this, Creo Simulate was used, and the results for each of the designs are shown below. It should be noted that although the these brackets do not include the camera, a point mass was created and tied back to the mounting holes with weighted links (RBE3 constraint equations).
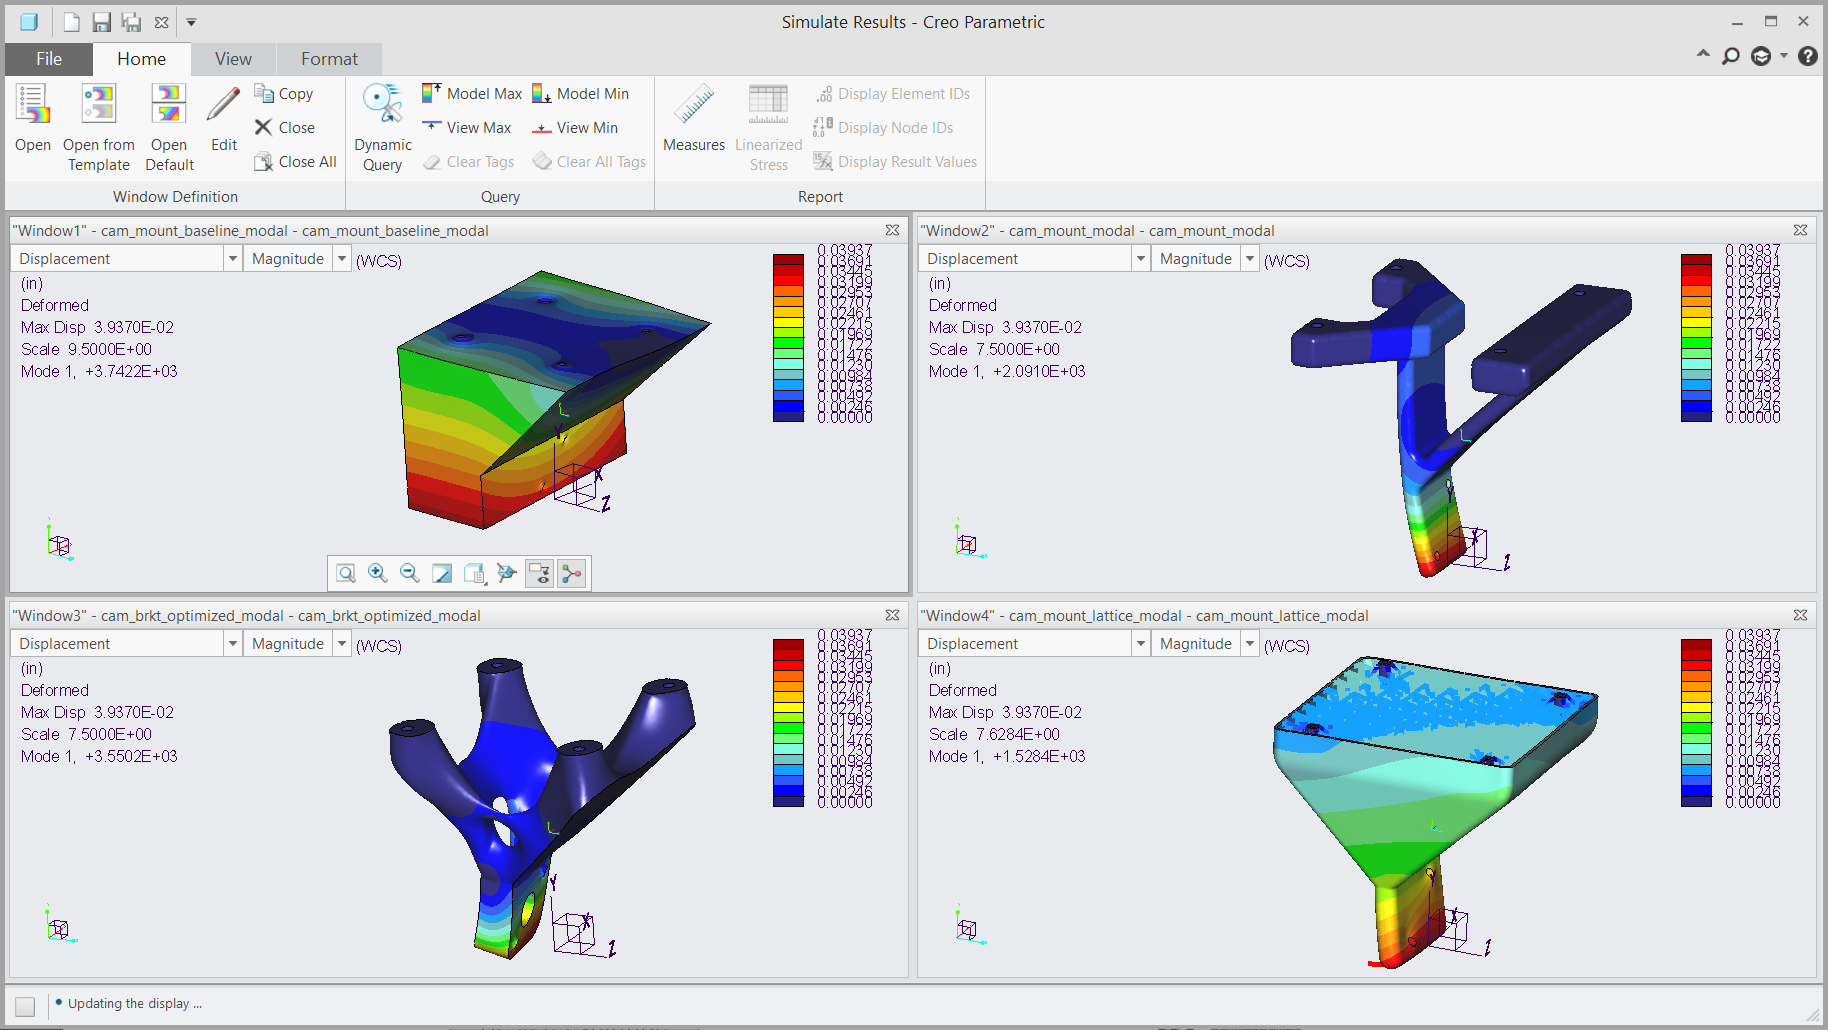
Creo Simulate predicts that the CNC machined "traditional" design resonates at 2,091 Hz. Comparing this to the CSL result of 1,720 Hz, the inverse relationship of speed vs. accuracy is highlighted. CSL does a perfectly fine job of showing us what the design trends are, such as what makes the frequency rise and fall, but traditional FEA can get us to within 5% of vibe table measurements. So, if we assume that the "real answer" is 1986 Hz, CSL is approximately 13% off. This is not a show stopper, but something to keep in mind moving forward.
It is certainly worth noting that designs 3 (Top Opt) and 4 (Lattice) can only be made using Additive Manufacturing techniques, where the material properties may need to be optimized based on available materials, processes, capabilities, and/or technology.
Looking at the pure performance (Mass Reduction Goal met and Maximized First Mode Frequency) in the graphic below, it's hard not to be impressed with the resulting design from the Topology Optimization algorithm. The First mode frequency is only 5% lower than the baseline block!
Do you want to learn how to perform Topology Optimization in Creo? Click below to be notified when the registration opens for our upcoming PTC Creo Structural Optimization Class in Q4 2019!